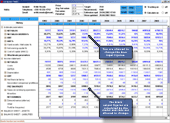
All the relevant estimate parameters can be
changed and updated by the user and the changes
made are automatically reflected in all other data.
A good way to become familiar with the model is
to look at our extensive
user documentation about the functioning and use
of the model.
Where do the numbers come from and how are they
updated?
 |
The company model estimates
in the database are updated by the brokers
whenever they change the numbers in their
excel-models.
|
|
The stock price
information (and thus all the depending ratios
like P/E etc.) are updated
daily from Reuters market data.
|
|
Users can download existing company models
from the database, change the numbers
and save them for their own private use.
|
|
Users can also create
new blank company models from companies that
are not represented in the database.
|
Model from
user's perspective compared to Excel-based valuation
models?
Traditionally over 90% of all financial analysis/valuation
models used by companies, investors
and sell-side analysts are Excel-spreadsheets, as
it is fairly flexible tool to form own sheets for
background analysis. However, in the client interface
we rely on a java-based solution. From the users'
perspective this means increased flexibility in
forecasting.
What this flexibility means in practise can
be illustrated with the following example:
In Excel models you can typically change
EBIT through the quarter-figures in different
divisions. These elements or base-figures are
futher summed up to get the total EBIT in some
quarter (or the total EBIT during the whole year
in some division) and these figures in turn are
summed up to get the total EBIT of all divisions
for the whole year. Yet, you can not directly
change the whole EBIT of one quarter or one division
or of the whole year and whole group. Nor you
can change any of these figures via EBIT margin
(%) -figures at different levels.
In Valuatum Company Models you can change
e.g. EBIT and
Net sales
at any of these levels and the other levels are
then automatically recalculated by the model to
change correspondingly. Therefore, lower levels
maintain their proportional values as they grow/shrink
according to the changes made by the user in upper
levels.
Our model is full of these
kind of different
forecasting paths. The user can forecast with
the variables which feel right for him-/herself
or are suitable for the particular situation or
for the company in question.
Moreover, since java-based
client interface has all the equation algorithms
build inside the model, it is quite robust to errors
and typos made in the input data, i.e. the equations
can not be mistakenly changed.
There are also many other
reasons why Valuatum has chosen java-based client
interface instead of Excel, but those are not so
explicit for the user.
For more information on the company model:
Have
a deeper look into how
the model works
Valuatum
Client Screenshots
Parameter Query - Database Queries
End-user can create and run searches from the database.
The database includes all the forecast values for
the companies in it as well as history data. Hence,
the user will easily find answers to the following
questions:
|
Which 20 companies have the highest dividend
yields this year, next year and thereafter?
(with yesterday's close prices and current
estimates)
|
|
Which set of companies have ROE-% 1999-2003E
over 20% (each year or on average during the
period) and current P/BV (with yesterday's
close prices) below 1.2?
|
|
Which set of companies have net sales/EBIT
or EPS growth-% 1999-2003E over 20% and current
P/E below 25 (with yesterday's close prices)?
|
|
What are the key figures between 1997 - 2004E
for selected industry or a set of companies?
|
|
How have the estimates of a company P/E,
EPS or EBIT forecasts during the last 6 months
changed?
|
|
How has the stockbroker's EPS forecasts for
a specific company changed over past year?
|
For more information see:
Technical
information about Valuatum Client
Valuatum
Product Benefits
Valuatum
Network
Valuatum
Starting Instructions
Screenshot tours from Valuatum client:
Company
Valuation Model Screenshots
Parameter
Queries Screenshots
You can probably find competitive products (Valuation
Software) from these Google ads below:
|