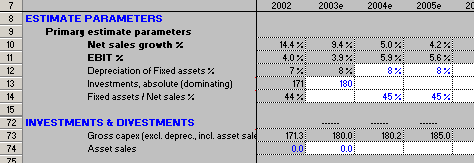
You do not necessary have to do anything yourself. You can however affect to the minimum level of liabilities and how the difference is allocated between the short and long-term liabilities. The parameters needed can be found below the balance sheet rows. Since the "balancing assets and liabilities" -process works exactly the same way both in Valuatum Excel and Java model, you can see more details in ValuModels tutorials about balancing assets and liabilities. 2.2.2 Debt and cashInterest bearing liabilities Interest bearing liabilities are output-figures. They are part of the process of balancing assets and liabilities. They are in most cases the items that adjust themselves to make assets and liabilities equal (see the previous chapter). If you want, you can of course determine also the level of interest bearing liabilities but that must be done either undirectly by estimating other balance sheet items or by determing the minimum level of interest-bearing liabilities. Non-interest bearing liabilities Long-term liabilities are an input figure and short-term are estimated with the corresponding percentage figure in the Estimate parameters section. Interest bearing financial assets (cash) The normal parameter is estimated with the percentage figure (compared to net sales). The generated parameter depends on the difference of assets and liabilities (see the previous chapter). 2.2.3 Investments and fixed assetsIn order to calculate fixed assets, you need to estimate the investments. You have two possible ways to estimate them: as absolute investments or as relative to fixed assets. Both options can be found in the Estimate parameters section of the I-main sheet. If you enter numbers to both fields, again the absolute figure is dominating, just like in net sales and ebit.
Exceptional change in fixed assets When fixed assets increase in a way that cannot be explained with normal items (investment, depreciation, asset sales), you can use a parameter called Additional fixed assets at the end of the I-main sheet. This kind of situation may be relevant for example in a case of a merge of two companies. 2.2.4 Other balance sheet parametersGoodwill An output figure (see also goodwill amortization). Inventories, financial assets and non-interest bearing current liabilities These items form Working capital. Each of them can be estimated with an own estimate parameter in the Estimate parameters section of the I-main sheet. Remember that generated interest bearing financial assets are generated automatically. So you cannot affect them directly. Retained earnings In the normal case the value of this parameter is calculated from the previous year's retained earnings, income statement's profit for the period and dividends. However, for example during a merge there may come extra retained earnings that have to be added to the balance sheet. For these kind of situations there is a parameter called Additional retained earnings, which can be found at the end of the I-main sheet. Other parameters The rest of the figures are with blue colour and thus can be estimated directly as an input figure. 2.3 WACC (weighted average cost of capital)WACC is calculated in Financial key value drivers section. Its subparameters (cost of debt, equity beta, etc.) can be found in the column B. Tax rate Tax rate is a bit exceptional compared to the other subparameters since it is used also outside of WACC.
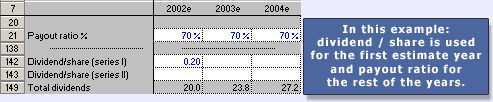
2.4 DIVIDENDS AND SHARE INFORMATIONEstimating dividends Total dividends are calculated as:
(In history total dividends are always calculated using dividend/share.)
|
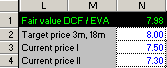
Share prices Historical share prices are entered in Capitalization section but for the current prices you can use the cells N3:N4 in the upper fields. Notice that the share prices in the Excel model are only for inner use. When you update the model available for users, the latest prices are retrieved from the database.
|
|
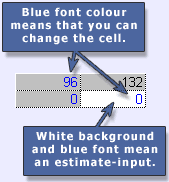
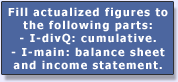
Splits and issues For adjusting share prices and no of shares in history, you have a parameter called Splits and stock issues. It has the same logic as in ValuModels: see more about splits. 2.5 UNDERVALUED ASSETS IN COMPANY VALUATION (I-investments sheet)If a company has a lot of undervalued assets (real value much more than book value) on its balance sheet compared to its own market capitalization, it may be reasonable to estimate the effect of these shares separately. For this purpose you have a sheet called I-investments. The sheet has two tables: one for quoted and one for unquoted shares. 3. History years and quarters3.1 HOW TO TELL TO THE MODEL WHAT IS THE CURRENT QUARTER3.2 HISTORY IN INCOME STATEMENTYears (Y-1...Y-4) in history (and current year, Y+0) Actualized income statement is mostly filled to I-divQ, where at the end of the sheet there is a section of cumulative figures (from the row #143). When the numbers are in blue font, you can override a possible formula in the cell.
There are also certain rows that you cannot fill in quarter-level figures (I-divQ sheet). These include costs, goodwill depreciation, financial items in sublevel and other adjustments. You may fill these in I-main for history years, if you like. History years Y-5, Y-6 and Y-7 In I-divQ there are only four history years in quarterly level. The three years behind them can be filled in full-year level in the I-divQ sheet (net sales and ebit) and in the I-main sheet (the rest of the parameters).
3.3 HISTORY IN BALANCE SHEETBalance sheet figures (both history and estimates) exist only in the I-main sheet as we do not have quarterly balance sheets. In historical balance sheet the figures are in blue font, i.e. every figure is an input figure (excl. two sum rows: total equity and total financial assets). You can fill these cells using the historical financial information you have about the company. After running the year change macro, some cells (in blue font) might include formulas, since they used to be estimated indirectly with another parameter. Since they are not estimate numbers anymore, you should fill the actualized numbers also to these cells. It is important not to leave any formulas to history years.
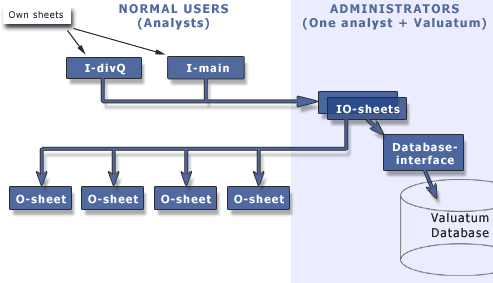
4. Output calculations and key figuresAll the key figures are in principle calculated in output sheets (O-sheets) that are created and maintained by the stockbroker (see different sheet types).
|
5. Changing year or quarter5.1 CHANGING QUARTER (Q1, Q2, Q3)When the company announces its interim report (Q1, Q2, Q3), do the following things:
When Q4 result is published, see the following chapter. 5.2 CHANGING YEAR (Q4)Every time when the company publishes its Q4 result, the model must be updated. In order to avoid a lot of manual work and to ensure that everything is done correctly without human errors, you must use YearChange macro in this operation. Basically it removes the latest history year, adds a new estimate year and updates dozens of links involved. Please follow these instructions, when you fill Q4 results:
|
|
|
Now the macro runs a few seconds and when it has finished, it will give a message box. Do the following things after the macro:
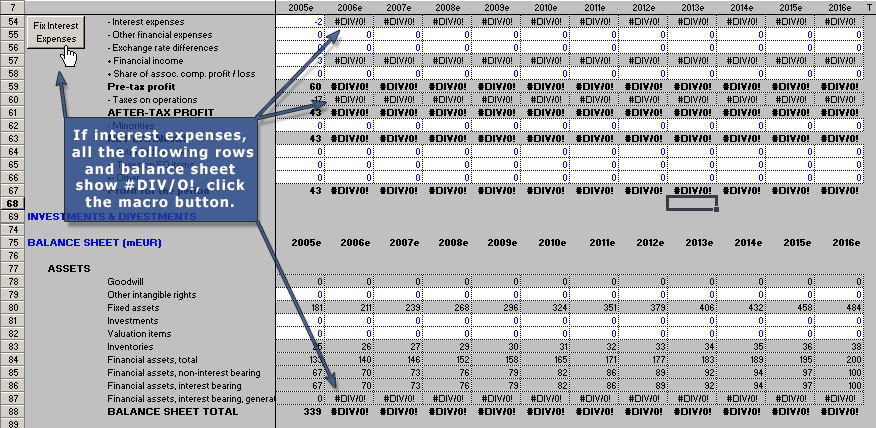
You do not need to do anything to the O-sheets. IO-sheets make sure that the current year in O-sheets is in the same column than before the YearChange macro. Same goes for the Database-Interface sheet. (More info about YearChange macro in Excel Q&A.) 6. Possible problems6.1 #DIV0 / #REF IN INCOME STATEMENT AND BALANCE SHEETWhen income statement and balance sheet are estimated, there is always a problem with a loop (interest expenses affect to themselves):
In Valuatum Excel Model this loop has been solved with iteration (Tools - Options - Calculation - Iteration). However, if there is an error inside of the loop (like always in the beginning when you start filling an empty model), the iteration does not work anymore.
|
That is why the model includes a macro called 'FixInterestExpenses'. It fixes the error and activates the iteration again. You can start the macro with the corresponding button on the left side of income statement (I-main).
|
|
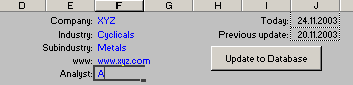
6.2 NEED FOR CHANGE IN MODEL INPUT SHEETS (e.g. in a formula)If you feel that you would like to change something in the model in I-sheets (outside users' own area), please do not change anything on your own but contact the "model officer" within your own organisation or contact Valuatum. The change will be done using conversion macro simultaneously to all models. 7. Other issues7.1 INFORMATION IN UPPER FIELDSThe main information of a company is filled to the upper fields of the I-main sheet. The information is needed when the model is updated to the database. The important fields are:
The current year's share prices are only for your own purposes since the latest prices are retrieved from the database when the model is updated to the database.
|
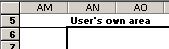
7.2 ANALYST INFORMATIONIn order to update the model to the database, you need to fill also a bit of information of yourself: write your username and password of the Valuatum system to the Database-interface sheet. If you like, you can also write your name to the I-main sheet (see picture above) but it won't be used outside of the Excel model. 7.3 USER'S OWN AREAOn the right side of each sheet there is an area called User's own area. That is the place where you can make larger preparations to you single estimates. Please, do not use any cells outside of the area. That is because sometimes the empty model is updated and then all the models in use are converted with a macro to the new model. The macro copies only the input (blue) figures and the own area cells from the old model to the new one. Thus if you have made your own calculations somewhere else, they will disappear. 7.4 OWN SHEETS AND WORKBOOKSBesides of the own areas, you are allowed to have extra sheets. They may be useful if you need to make more specific estimates, e.g. about unit volumes, sales prices, raw-material-prices, utilization degrees etc. When the model is updated, the conversion macro will copy your own sheets to the new model. Also having links to external workbooks is allowed. During the conversion these links are not affected. 7.5 DIVISION NAMESThe division names that are shown in ValuViews (html pages) and ValuModels (java model) are written to the I-divQ sheet. See more info from estimating parameters in I-divQ. 7.6 ESTIMATE AND INFO FIELDS
|
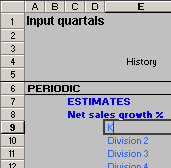
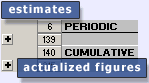
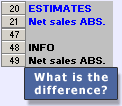
In the periodic part of the I-divQ sheet, you can see 'Estimates' and 'Info' fields. 'Estimates' are naturally for your estimates and 'Info' tells you the actual periodic figures. The latter takes the figures from cumulative or periodic part depending on whether the quarter in question has actualized.
|
|
7.7 HOW TO UPDATE MODEL IN GENERAL LEVEL (conversion)?Sometimes there is a need to make a change to the model in general level. These kind of situations may be, for example:
The change will be made to a file called emptymodel.xls. Then by using conversion macro, the input data in the old files will be copied to the new file. The process is quite simple and requires about 20 seconds per model. The macro is used so that the changes can be easily implemented to each model in use. Analysts do not need to do the work themselves; after the changes have been made to the empty model, the macro does the rest. 8. Macros used in the modelValuatum Excel model contains three macros:
|
|||||||||||||||||||||||||||||||||||||||||||||||