ValuViews are a comprehensive set of web-pages consisting of wide range of equity analysis information, updated market data and estimates as well as history data used e.g. for comparison and rating purposes.
Stockbroker or independent equity research provider can choose what information to show in the pages, possible figures are the one (those 9000/company) that can be taken from the database. Also when the broker would like to change e.g. a graph or table, the pages with the new kind of graphs and tables are available immediately after one hour.
As an extremely user-friendly web-product, ValuViews provides its users with a neat and compact package of all information needed for conducting a professional analysis of equity investments
Try out Demo of ValuViews!
Company Views
View numbers of individual companies as tables and charts up to quarterly and divisional level (and view the Pdf-reports of the company). To offer up-to-date information all pricing figures are updated every day with previous day’s share price.
You can also change some estimate parameters through your web browser (by simply pressing Change estimates button) according to your own views and see how this affects to company’s income statement, balance sheet, valuation, key figures and etc. If you wish to have more flexible tool with more options please try out ValuModels (presented below).
Company Views section includes
- Background: Company description and ownership data
- Overview: Key financials, key figures and pricing data
- Est. vs. Actual: estimates versus actual figures
- Valuation: DCF and EVA valuation
- Divisions: Detailed divisional sales and earnings data
- Quarters: Detailed quarter figures
- Graphs: Collection of graphs showing most important key figures, both history and estimate figures.
Browser Model
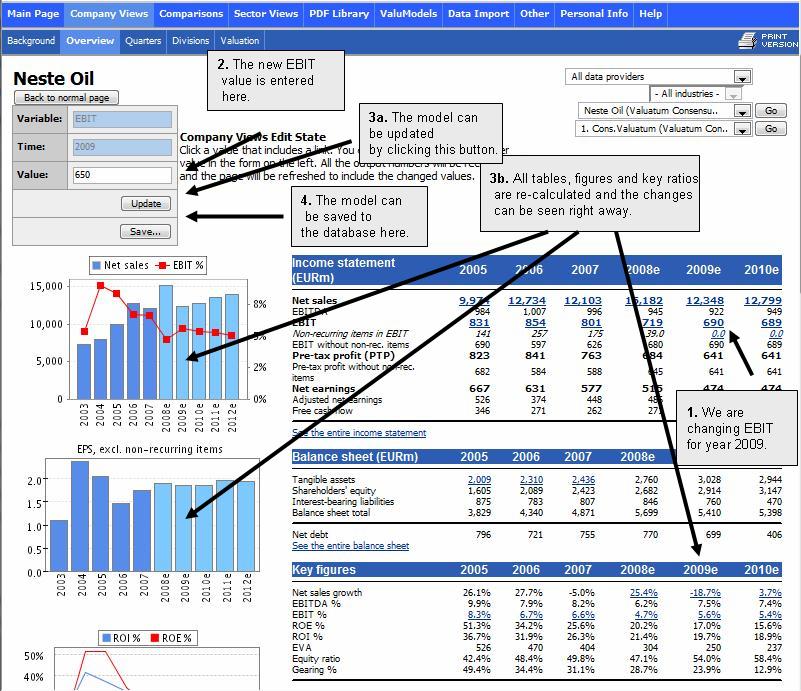
The easiest way of making changes in the valuation model (e.g. sales and EBIT forecasts) is to make them directly though the ValuViews interface. By choosing "Make Own Estimates", the system shows all changeable items as links. In the browser model, the user can easily change the value of each item, and after every change the valuation model is completely rerun. Thus, it is easy to track the changes and their effect on the valuation of the company. With one click the changes can be saved to the database and the new figures are immediately analyzable with any comparison tool.
An example how the Browser Model works | 
|
Sector Views
View key financials, key figures and pricing data of different sectors. You can also find sales and earnings data up to quarterly level or browse graphs for different sectors. Figures in Sector Views pages are also calculated every day with the current share prices.
Comparisons
When using the following tools you can create and save your own lists by including only the parameters and companies you want.
Rankings: Quickly sort companies by using any single key ratio like P/E, ROE% and etc.
Multi-criteria Rankings: In addition to normal Rankings you can use multiple criteria and set weight factors to them.
XY Scatter: Enables you to graphically compare valuation multiples such as P/E, P/BV, EV/EBITDA to explanatory variables such as ROE or profit growth to separate the over and undervalued companies.
In addition Comparisons section also includes Recommendation and Collection.
Pdf library
This section provides access to client's analysts’ reports in PDF format. You can search and access reports by industry, company, analyst and etc.
Firm specific Pdf-reports can also be accessed through firm’s Company Views pages.
ValuModels
ValuModels can be accessed from ValuViews. See more info from own section of ValuModels.
» System » ValuModels