ValuModels
ValuModels is designed to offer an interface for investors to access broker's equity research data in a modern and sophisticated format. Company valuation models (ValuModels) can also be used as a stand-alone valuation/financial analysis software.
|
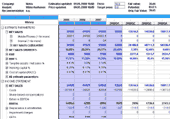
ValuModels is a Java based full financial analysis model, which provides you an easy and flexible way to test your own assumptions on company valuation. Users can change all the relevant estimate parameters and see how this affects the key figures and DCF-based valuation. ValuModels includes e.g. Income statement, Balance sheet, Valuation analyses (DCF and EVA) and other key figures useful in the analysis. To get a better idea of ValuModels, please visit here.
|

|
Features
- Model includes: Income statement, Balance sheet, Estimate parameters, Valuation analyses (DCF and EVA), Other key figures useful in analysis
- All the relevant estimate parameters can be changed and updated by the user and the changes made are automatically reflected in all other data
- You can open the mode anywhere, only computer and internet connection are needed
- Java-based client interface has all the equation algorithms build inside the model, it is quite robust to errors and typos made in the input data, i.e. the equations can not be mistakenly changed
Where do the numbers come from and how are they updated?
- The company model estimates in the database are updated by the brokers whenever they change the numbers in their excel-models.
- The stock price information (and thus all the depending ratios like P/E etc.) are updated daily from Reuters market data.
- Users can download existing company models from the database, change the numbers and save them for their own private use.
- Users can also create new blank company models from companies that are not represented in the database.
Model from user's perspective compared to Excel-based valuation models?
Traditionally over 90% of all financial analysis/valuation models used by companies, investors and sell-side analysts are Excel-spreadsheets, as it is fairly flexible tool to form own sheets for background analysis. However, in the client interface we rely on a java-based solution. From the users' perspective this means increased flexibility in forecasting.
An example what this flexibility means in practice
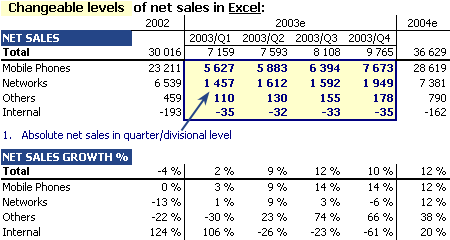
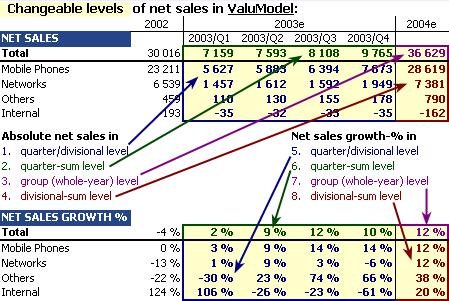
Traditional Excel based valuation model is quite inflexible as you can have formulas built only in one direction: the most important estimates like net sales or ebit can only be changes at one level amongst 8 possible. On the contrary, Valuatum model allows changes at any of the 8 levels. The both cases are illustrated below:
As you change the estimates at sum levels in ValuModel (sum of divisions in one quarter, sum of quarters in one divison or the whole year/group level), then the change is allocated to lower levels in the proportions of old estimates.
Our model is full of this kind of flexibility; different forecasting paths. The user can forecast with the variables which feel right for him-/herself or are suitable for the particular situation or for the company in question (dividends as per share figure or with dividend yield, investments as absolute figure, relative to sales or via fixed assets/sales-% etc.) |
 |
 |


