Seasonal variation in estimates
Some companies have quite stable turnover and operating profit between different quarters. However, other companies tend to sell each year more in certain time or make the most of the profit in certain quarters.
Consider for example a skiing centre: the most of the turnover is created in the winter, while the revenues in the summer may be close to nothing. Again, some consumer goods are sold mainly at the end of the year around Christmas.
This phenomenon is called seasonal variation and you should take it into account when you think about your estimates.
How to take seasonal variation into account in Valuatum Excel model?
There are three things that help you in this:
- Division graphs in I-divQ sheet
- Info fields in I-divQ sheet and
- Quarter graphs in O-quarter sheet
The divison graphs are most helpful things with estimating the seasonal variation and therefore there is even an own tutorial page for them. You really should learn how to use them.
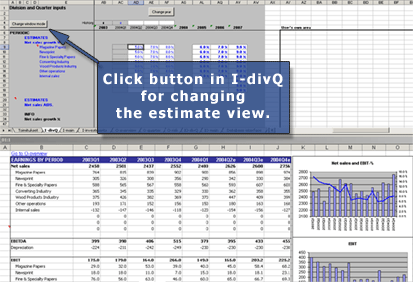
Info fields in I-divQ sheet and Quarter graphs in O-quarter sheet
When you look at the Info fields in I-divQ, you can see the periodic historical values and also your estimates in the same rows. If there are considerable variation between quarters, take it into account in your estimates.
Perhaps an easier way to notice a possible variation is to look at the graphs in the O-quarter sheet. You can just change the sheet or change view: click the button in the left upper corner of I-divQ and you get two sheets to the view at the same time. When you click the button again, you will get back to the original view.