

How Does Automatic Recommendation Work?
Valuatum Automatic Recommendations tool is based on a simple but academically researched idea which suggests that by using back- and forward looking pricing multiples and value drivers like price to book (P/B) and return on equity (ROE) % in stock screening an investor can beat index profits.
Calculation Methods
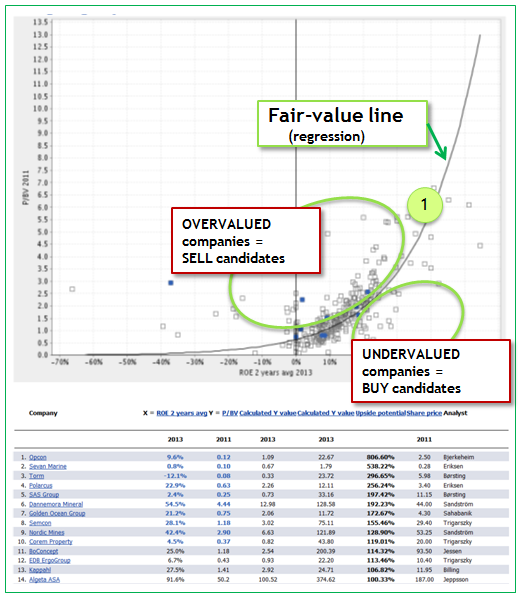
The Automatic Recommendation generates upside/downside potential for each stock included in the sample.
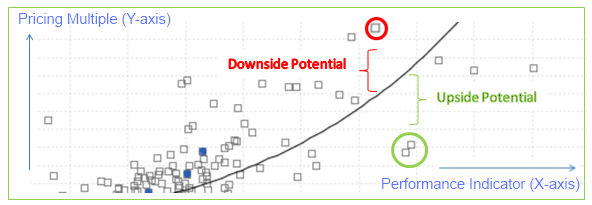
First the tool calculates both back and forward looking pricing multiples. Back-looking multiples like P/B are calculated based on historical data and current share price. Forward-looking multiples like expected ROE % are calculated based on consensus estimates. The example graph on the right has the pricing multiple P/B on the y-axis and the expected ROE % on the x-axis.
Secondly the tool calculates a fair line based on ordinary least squares (OLS) method. Assuming that the consensus estimates of performance indicators are approximately correct it is possible to say that stocks far below the fair value line are most likely underpriced and stocks far above the fair value line are overpriced. The upside/downside potential is calculated based on the difference between the stock’s current value and the corresponding fair value.
Tracking Historical Recommendations
![]() Automatic Recommendations tool includes an unique feature for tracking the performance of historical recommendations. This means that any investor can see how their strategy would have worked over defined time period in history (eg. during "bull" or "bear" market conditions).
Automatic Recommendations tool includes an unique feature for tracking the performance of historical recommendations. This means that any investor can see how their strategy would have worked over defined time period in history (eg. during "bull" or "bear" market conditions).
Stocks are sorted based on their estimated upside/downside potential in the beginning of the period. The tool offers information per each stock about the target prices, potential, share price in the end of the period and differences between model forecast and actual outcome.
In addition to the list the changes of top recommended stocks are vizualized in a graph. The graph makes it easy to track eg. the fairness of the consensus estimates. The movements of the stocks are displayed in a graph where both estimated and realized performance indicators are plotted. The graph displays if the stocks have overperformed the market (green line) or underperformed the market (red line). In addition to this the entire sample of stocks are displayed in a table together with their individual estimated upside potential and realized returns.
The Tracking Strategy feature compares the average returns of ten stock portfolios with the average return of the indice. Comparing these portfolios provides information about the performance of the recommendations on average.